Web GIS & ArcGIS Online
Property portfolio dashboard scored for walkability, biking and transit
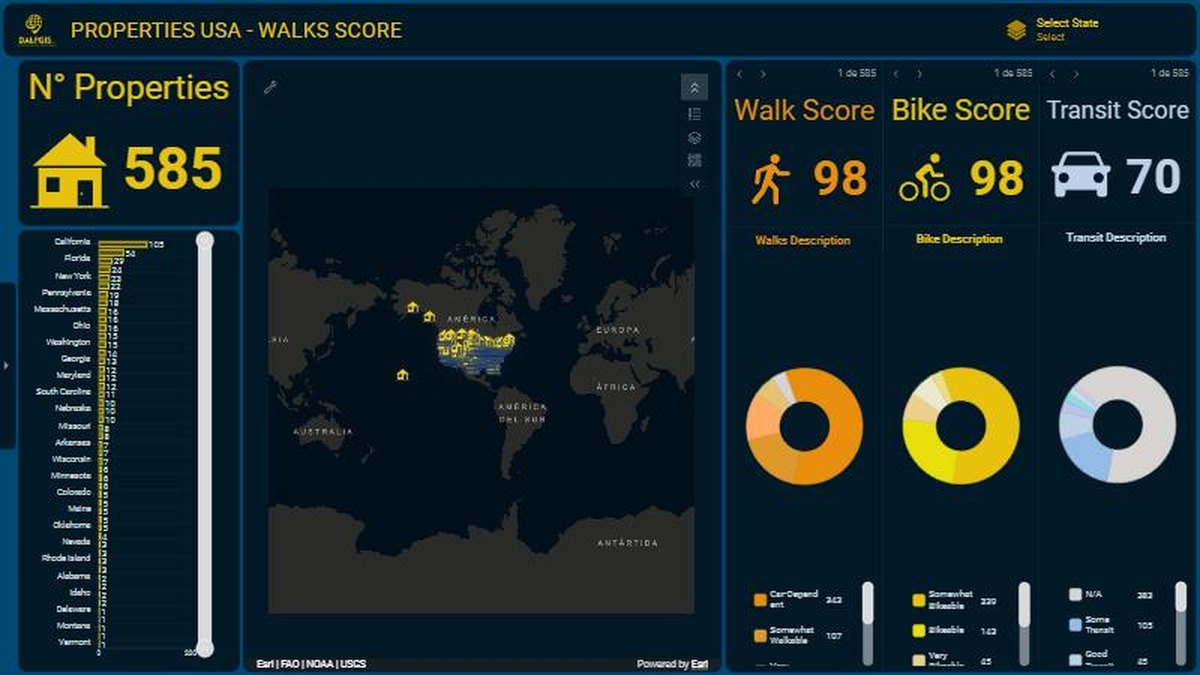
An ArcGIS dashboard that turns 585 properties into a story: how walkable, bikeable and transit-friendly each location is.
The challenge
A long list of properties says little. The goal was to analyse the data well enough to build a clear story about which locations are easy to live in without a car.
The solution
I joined each property to Walk, Bike and Transit scores and built a dashboard where selecting a state, a map area or a single property updates every indicator.
- Prepare: clean the property table and attach the three accessibility scores.
- Design: one counter for the number of properties, three score gauges with plain-language descriptions, and a state ranking.
- Interact: every element filters the others, so the user can go from the national view to one address.
Results
- 585 properties analysed in one interactive view
- Walk, Bike and Transit scores shown side by side with a written description
- Ready-made support for client conversations and investment screening
Deliverables
ArcGIS Dashboard · Data preparation workflow
Gallery
Next step
Need something similar?
Tell me about your data and your goal. I will reply with a clear approach, timeline and quote.