Automation & Spatial Data
Real-time climate station monitoring with an automated ArcGIS notebook
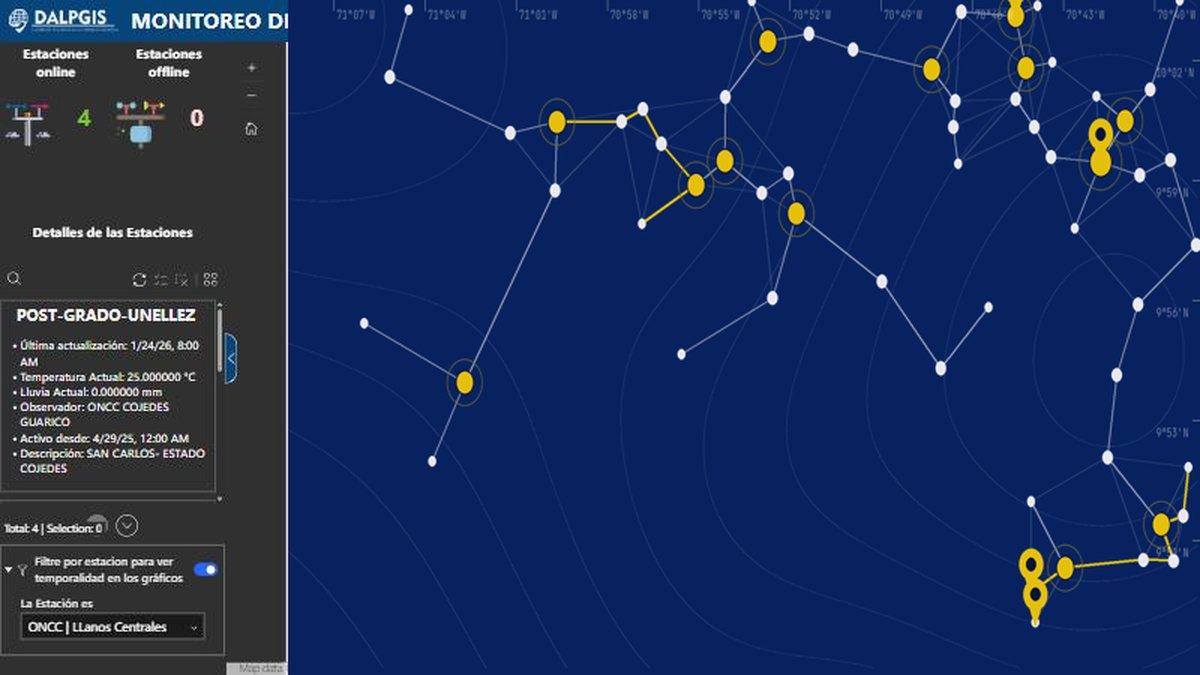
A dashboard that shows which weather stations are online and what they measure, fed automatically by a scheduled notebook task.
The challenge
Weather stations from different observers were reporting in different places. The team had no single, current picture of which stations were alive, when each had last reported, and what temperature and rainfall they were recording.
The solution
A scheduled ArcGIS Online notebook task runs on its own, reads the data published by each station, cleans it and writes it to a hosted feature layer. An Experience Builder viewer reads that layer, so the map is always fresh without anyone uploading a file.
- Ingest: a Python notebook pulls the latest readings from each station source.
- Store: values are appended and updated in a hosted feature layer, keeping the history for charts.
- Show: the viewer counts stations online and offline, lists each station with its last update, current temperature and rainfall, and lets the user filter charts by station.
Results
- Online / offline status for every station at a glance, updated automatically
- No manual uploads: the notebook task keeps the layer current
- Per-station detail (observer, active since, last reading) one click away
Deliverables
Scheduled ArcGIS notebook task · Hosted feature layer · Experience Builder viewer
Gallery
Next step
Need something similar?
Tell me about your data and your goal. I will reply with a clear approach, timeline and quote.